
West Berkshire's claimant count fell again in July, to 2,395. But 18 to 24 year olds hit 435, up 26% in a year, the steepest rise in the South East.
The number of people claiming unemployment-related benefits in West Berkshire fell for a second month in July, to 2,395. Among 18 to 24 year olds it did the opposite. Their count reached 435, the highest since November 2021, and up 26.1 per cent in a year.
That is the steepest year-on-year rise in young claimants of any of the 19 county and unitary authorities in the South East, on ONS claimant count figures published through nomis on 18 August.
The district’s overall rate stayed at 2.4 per cent of residents aged 16 to 64. That is comfortable. The South East average is 3.1 per cent and the UK average 3.9 per cent, and only Wokingham is lower in Berkshire. The under-25 figure is the number that has moved.
What changed in a year
West Berkshire had 2,340 claimants in July 2025 and 2,395 in July 2026, a rise of 55. Young people account for more than all of it.
| Age band | July 2025 | July 2026 | Change |
|---|---|---|---|
| 18 to 24 | 345 | 435 | +90 |
| 25 to 29 | 265 | 285 | +20 |
| 30 to 34 | 285 | 250 | -35 |
| 35 to 39 | 270 | 280 | +10 |
| 40 to 44 | 270 | 235 | -35 |
| 45 to 49 | 230 | 210 | -20 |
| 50 to 54 | 210 | 195 | -15 |
| 55 to 59 | 215 | 225 | +10 |
| 60 to 64 | 205 | 200 | -5 |
| 65 and over | 40 | 70 | +30 |
Every band between 30 and 54 fell. The 18 to 24 band rose by 90 on its own.
The rise is not a national pattern reaching Newbury late. UK-wide, 18 to 24 claimants went from 299,680 to 328,865 over the same year, up 9.7 per cent. Across the South East they rose 12.2 per cent. West Berkshire’s 26.1 per cent is more than double the regional rate.
Nor is it a one-month blip. The district’s under-25 count has climbed in most months since last autumn: 345 in July 2025, 390 by November, 430 by March, 435 now.
Berkshire’s six compared
The old county was split into six unitary authorities in 1998, and they still make the most natural comparison. On the year’s change in 18 to 24 year old claimants, West Berkshire is well clear of the other five.
| Authority | 18-24, July 2025 | 18-24, July 2026 | Change | Overall rate |
|---|---|---|---|---|
| West Berkshire | 345 | 435 | +26.1% | 2.4% |
| Bracknell Forest | 360 | 415 | +15.3% | 2.7% |
| Wokingham | 360 | 410 | +13.9% | 2.0% |
| Slough | 895 | 940 | +5.0% | 6.0% |
| Windsor and Maidenhead | 335 | 350 | +4.5% | 2.5% |
| Reading | 850 | 885 | +4.1% | 4.3% |
Slough and Reading have far higher overall rates than West Berkshire, and their young claimant counts barely moved. West Berkshire has one of the lowest overall rates in the region and the fastest-rising youth figure.
Newbury’s wards carry the district’s highest rates
Ward figures are published from January 2026 onwards. In July, the three highest rates in the district were all Newbury wards, and Newbury Greenham had the largest number of claimants of any ward at 270.
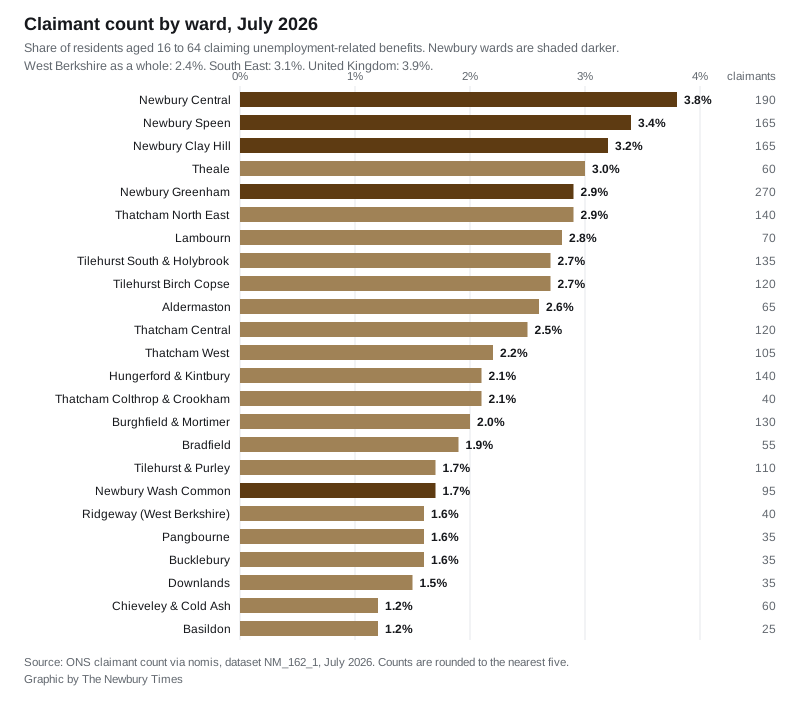
Newbury Central, at 3.8 per cent, is more than three times the rate in Chieveley and Cold Ash and in Basildon, both 1.2 per cent. Note that Basildon here is the West Berkshire ward covering the Basildon and Lower Basildon area near Pangbourne, not the town in Essex.
Since January, the biggest ward movements have been:
- Newbury Speen up 20, from 145 to 165, the largest rise in the district
- Newbury Central down 15, from 205 to 190, the largest fall, though it still has the highest rate
- Thatcham West up 15, from 90 to 105
- Tilehurst and Purley up 15, from 95 to 110
- Thatcham North East up 15, from 125 to 140
All three Thatcham wards rose over the six months. Newbury’s five did not move together: Speen, Clay Hill and Greenham rose, Wash Common held level and Central fell.
Two cautions on the ward numbers. Nomis rounds every count to the nearest five, so a movement of five is inside the rounding and means little on its own. And the 24 ward counts sum to 2,405 against a district total of 2,395, which is the same rounding at work.
What the claimant count does and does not measure
The claimant count is not the unemployment rate. It counts people claiming Universal Credit who are required to look for work, plus the remaining Jobseeker’s Allowance claimants. Some are in work on low hours and still required to search for more. People who are out of work but not claiming, including many who have never claimed, do not appear at all.
It is still the only monthly measure published down to individual wards, which is why it is worth reading closely at this level even though it undercounts.
What it means for you
If you are 18 to 24 and out of work in West Berkshire, you are in the group the figures say has grown fastest in the region this year, which also means you are competing against more people locally than a year ago. The National Careers Service helpline (0800 100 900) is free and does not require a benefit claim.
If you are hiring, the same figures say the local pool of younger candidates is noticeably deeper than it was in summer 2025.
If you want to check your own ward, the full breakdown is in the chart above, and the underlying series is free to query at nomisweb.co.uk. August 2026 figures are due in mid-September.
For the other half of the local money picture, our Newbury house prices page tracks the Land Registry index for the district, and Newbury planning news follows what is being built and where.
Source: ONS claimant count, dataset NM_162_1, via nomis, July 2026 release, published 18 August 2026. District and regional figures are for all claimants aged 16 and over; rates are the proportion of residents aged 16 to 64. All counts are rounded to the nearest five.
Have your say