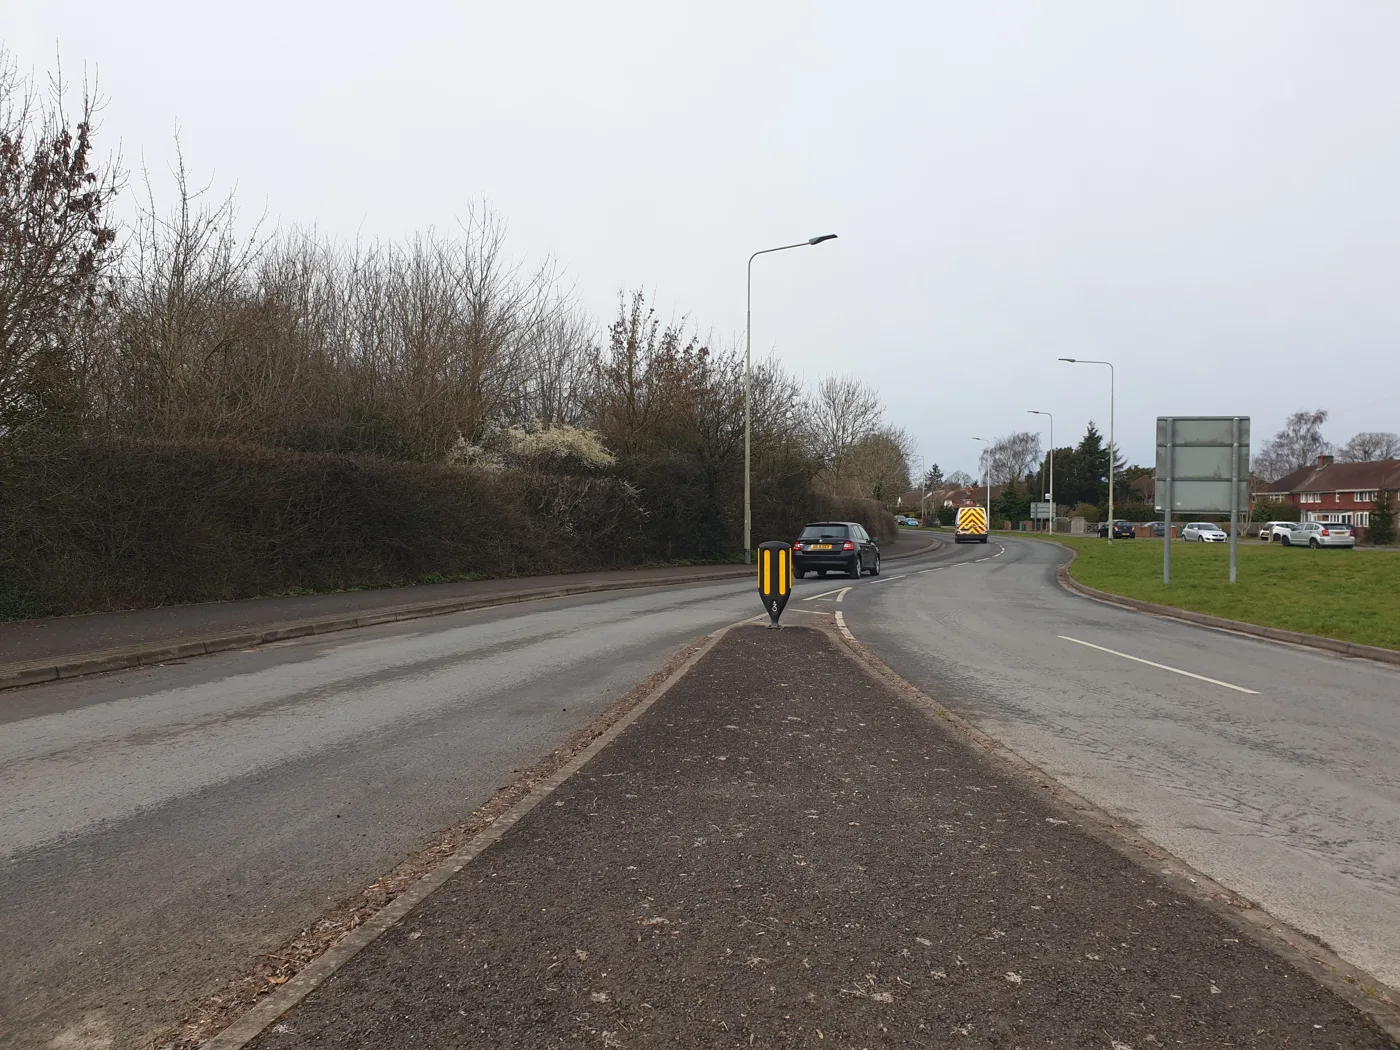

West Berkshire will treat 45.6km of road this year. Newbury's share is 150 metres, on Monks Lane. Lambourn gets 8,049. The pavement list is the other way round.
West Berkshire Council will treat 45.6km of road across the district this year. One hundred and fifty metres of it is in Newbury.
That is the whole of the town’s share of the 2026/27 Highway Improvement Programme. The scheme is numbered Rtx 04 on the council’s own spreadsheet, and it is retexturing on Monks Lane, from outside number 36 to outside number 27. Nothing else in Newbury parish is on the list.
The figure is checkable because the council publishes the programme as a spreadsheet, scheme by scheme, with an extent and a length for each one. Its own totals match: 41 schemes, 45,603 metres, 256,268 square metres. (West Berkshire Council, Highway Improvement Programme)
The page carrying it returned a 404 error when we checked it four days ago. It is working again now.
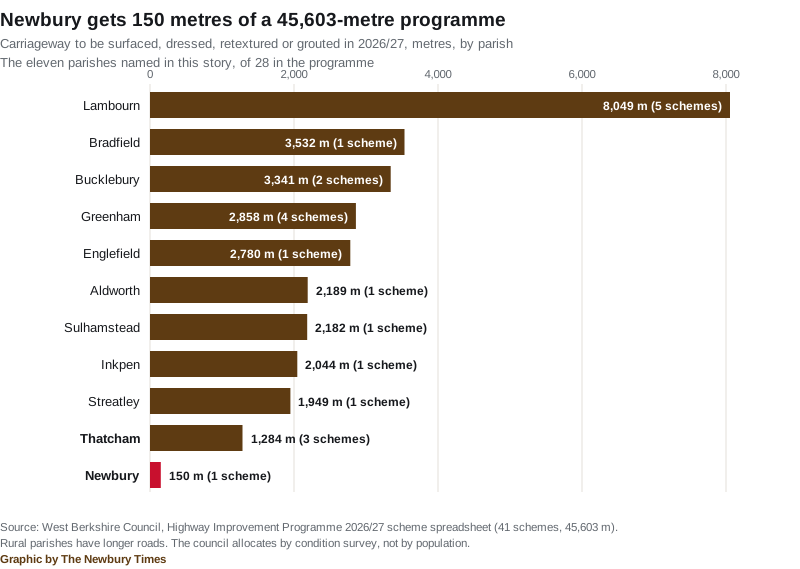
Lambourn gets 8,049 metres. Newbury gets 150.
Sorted by parish, the programme looks like this:
| Parish | Schemes | Metres |
|---|---|---|
| Lambourn | 5 | 8,049 |
| Bradfield | 1 | 3,532 |
| Bucklebury | 2 | 3,341 |
| Greenham | 4 | 2,858 |
| Englefield | 1 | 2,780 |
| Aldworth | 1 | 2,189 |
| Sulhamstead | 1 | 2,182 |
| Inkpen | 1 | 2,044 |
| Streatley | 1 | 1,949 |
| Thatcham | 3 | 1,284 |
| Newbury | 1 | 150 |
Newbury is last of the 28 parishes that appear at all.
Why that is not quite the scandal it looks like
Two things need saying before anyone writes to their councillor.
Rural roads are longer. Lambourn’s 8,049 metres are five schemes on lanes that run for kilometres between villages: Straight Lane, Long Hedge, the B4000 Upper Lambourn Road, the B4001 Stag Hill and an unnamed road off the High Street. Newbury’s streets are short, urban and mostly not classified. A programme measured in metres will always favour the countryside.
The council allocates by condition, not by place. Its method is set out in the report approved this month. Schemes come from SCANNER condition surveys, skid resistance surveys, reactive maintenance records, accident data, engineering inspections and visual assessments, then go through a weighted prioritisation matrix covering road classification, condition, deterioration trends, skid resistance, wet-weather injury accidents, defect history, network importance and deliverability. (West Berkshire Council, Highways Maintenance Transparency Report 2026)
So a Newbury road that scored badly would be on the list. On the council’s own surveys, one 150-metre stretch of Monks Lane did.
On pavements, Newbury does best in the district
There is a second programme, and it runs the other way.
The Footway Improvement Programme for 2026/27 has 18 schemes and 9,952 metres of pavement work, all of it micro surfacing. Seven of the 18 schemes are in Newbury, and they account for 2,871 metres, more than any other parish and 29% of the total.
The Newbury streets on it are:
- Monkswood Close, 710 metres
- Garford Crescent, 624 metres
- Henshaw Crescent, 598 metres
- Regnum Drive, 466 metres
- Stanley Road, 332 metres
- Fifth Road, from the Oaken Grove junction to the Valley Road junction, 100 metres
- Oaken Grove, from the Longacre junction to the Fifth Road junction, 41 metres
Thatcham has four schemes and 2,610 metres, on Beverley Close, Mount Road, Park Avenue and Brownsfields Road. (West Berkshire Council, Footway Improvement Programme)
One gap worth noting. The council’s transparency report says it will deliver “approximately 10.68km of preventative footway maintenance, covering 19,238m²”. The published scheme list adds up to 9,952 metres and 17,355 square metres. Around 730 metres of the promised work is not on the list we can read.
The money is falling, and not because the Government cut it
The clearer story is in the budget.
West Berkshire spent £20,000,670 on highways maintenance in 2025/26. Its projection for 2026/27 is £16,126,600. That is £3.87 million less.
The Government did not cause it. Funding from the Department for Transport and central government rose, from £9,818,000 to £10,226,156. What fell was the council’s own contribution, from £10,182,670 to £5,900,444, a drop of 42%.
Carriageway spending specifically falls from £15,829,922 to £11,074,530.
| 2024/25 | 2025/26 | 2026/27 projected | |
|---|---|---|---|
| DfT and central government funding | £5,387,000 | £9,818,000 | £10,226,156 |
| Council and third-party funding | £8,476,200 | £10,182,670 | £5,900,444 |
| Total spend | £13,863,200 | £20,000,670 | £16,126,600 |
| Of which carriageways | £10,326,206 | £15,829,922 | £11,074,530 |
Separately, the Highway Improvement Programme page puts the figure invested in the network through that programme in 2026/27 at £7.2 million. The two numbers measure different things: the £16.1 million covers everything from pothole gangs to gully cleaning and bridges, the £7.2 million is the planned improvement work.
The condition figures are going the wrong way on A roads
The council surveys its roads every year and sorts them into green, amber and red. Red means poor condition and should be considered for maintenance.
On A roads, the red share has risen three years running: 2.7% in 2023, 3.6% in 2024, 3.8% in 2025. Green has also risen, from 74.6% to 76.7%, because amber has shrunk from 22.7% to 19.5%. In other words the middle is emptying out in both directions, and the worst category is growing.
On B and C roads red has barely moved, from 3.4% to 3.5%. On unclassified roads it went from 4.6% in 2023 down to 2.9% in 2024 and back up to 3.6% in 2025.
For scale: the council maintains 1,303km of carriageway, 822km of footway, 33km of cycleway, 13,196 street lights, 607 structures and 32,184 gullies. This year’s 45.6km programme covers 3.5% of the carriageway network. It filled an estimated 3,095 potholes in 2025/26.
How often anyone actually looks at your road
The inspection frequencies are in the procedure approved this month, and they explain a lot about why a residential street can look neglected for a year.
| Road type | Inspection | Maximum interval |
|---|---|---|
| A, B and C roads, and urban bus routes on unclassified roads | Monthly, driven | 6 weeks |
| Link C and unclassified roads | Every 3 months | 16 weeks |
| Rural C and unclassified roads | Every 6 months | 30 weeks |
| Urban unclassified roads | Every 12 months, walked | 56 weeks |
Most Newbury housing-estate roads are urban unclassified. On the council’s own schedule, an inspector walks them once a year, and is allowed up to 56 weeks between visits. Everything else depends on residents reporting defects, which the procedure explicitly counts as intelligence alongside the surveys.
A pothole is a defect at least 20mm deep and 300mm across on most carriageways, or 40mm deep on minor roads. Very high-risk defects are made safe within 2 hours, high risk within 24 hours, moderate risk within 28 days.
The policy behind all of this can still be called in until Monday
None of the above is settled history. The council approved the framework three days ago.
Councillor Stuart Gourley, executive member for environment and highways, took the decision on the Highway Infrastructure Asset Management Strategy 2026 to 2031, the matching Policy, and the Highway Safety Inspection Procedures. The report was taken as an individual decision on 4 September and published on 7 September.
It is reference ID4824, and it is subject to call-in. If it has not been called in by 5pm on Monday 14 September, it takes effect on 15 September. The call-in count today is zero.
The officer report, by asset manager Andrew Reynolds, says there are no immediate additional financial implications, because the documents provide a framework for prioritisation “within existing approved capital and revenue budgets”. (West Berkshire Council, decision ID4824)
What it means for you
- If you live on Monks Lane between numbers 27 and 36, expect retexturing at some point this year. No date is published for any scheme on the programme.
- If you live on Monkswood Close, Garford Crescent, Henshaw Crescent, Regnum Drive, Stanley Road, Fifth Road or Oaken Grove, your pavement is on this year’s list.
- If your road is not on either list, reporting the defect is the mechanism that gets it looked at. The council’s own procedure treats customer reports as evidence, notifies you when the repair is done and sends a completion photograph. Reports go through westberks.gov.uk/reportaproblem.
- You can tag yourself to an existing report rather than filing a duplicate, and still get the updates.
- If you want to object to the new policy, the call-in window closes at 5pm on Monday 14 September.
- Two of this year’s schemes are about to shut roads. The B4009 Newbury Road in Hermitage closes on 16 and 17 September, and The Moors in Thatcham closes on the evening of 15 September. Both are on our Newbury roadworks and travel page.
Council tax pays for part of this. Newbury town’s band D bill for 2026/27 is on our council tax bands page.
Sources
- West Berkshire Council, Highway Improvement Programme, and its 2026/27 scheme spreadsheet, for the 41 schemes, their parishes, extents, treatments and lengths, the £7.2m programme figure and the September works list.
- West Berkshire Council, Footway Improvement Programme, and its 2026/27 scheme spreadsheet, for the 18 footway schemes, the streets, the treatment and the lengths.
- West Berkshire Council, Highways Maintenance Transparency Report 2026 for the network asset counts, the road condition percentages for 2023 to 2025, the spend and funding tables, the pothole definition and count, the response times, the 45.6km and 256,268m² programme totals, the 10.68km footway figure and the prioritisation method.
- West Berkshire Council, decision ID4824, 7 September 2026 and its officer report for the decision, the portfolio member, the report author, the call-in deadline, the effective date, the financial commentary and the carriageway inspection frequency table.
- West Berkshire Council, Report a Problem for the defect reporting route.
Have your say