
West Berkshire was the only Berkshire district where prices rose in the year to July, up 0.4% to £403,682. June's rise has now been revised into a fall.
The average home in West Berkshire was worth £403,682 in July 2026. That is up £1,773 on July 2025, a rise of 0.4%.
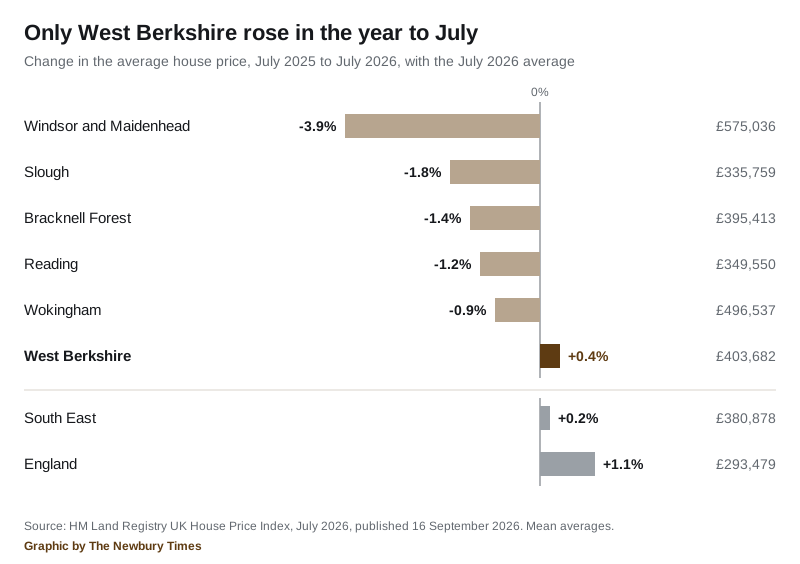
It makes West Berkshire the only one of Berkshire’s six councils where prices rose over the year. The other five all fell, and Windsor and Maidenhead fell by 3.9%.
The figures come from the UK House Price Index for July 2026, which HM Land Registry published on 16 September. England rose 1.1% over the same year. The South East rose 0.2%.
One thing to know first. The index figure is a mean average, not a median, so a handful of expensive sales in the villages pull it up. It is not what a typical home on your street sold for.
Berkshire went backwards, West Berkshire did not
| Council | Average, July 2026 | Change on the year |
|---|---|---|
| Windsor and Maidenhead | £575,036 | -3.9% |
| Wokingham | £496,537 | -0.9% |
| West Berkshire | £403,682 | +0.4% |
| Bracknell Forest | £395,413 | -1.4% |
| Reading | £349,550 | -1.2% |
| Slough | £335,759 | -1.8% |
A month ago the picture was less stark. In the first June figures, published in August, Reading and Slough were still rising. In July they are not.
The contrast is sharper across the county boundary. Vale of White Horse rose 5.7% and South Oxfordshire 3.0%. To the south, Basingstoke and Deane rose 1.0% and Test Valley fell 0.6%. Wiltshire, to the west, rose 2.6%.
Across all 295 council areas in England, West Berkshire is the 76th most expensive. On the annual change it ranks 199th. That sounds poor, but 85 areas recorded an outright fall.
Semis up, flats down
West Berkshire’s July figures by type of home:
| Type | Average, July 2026 | July 2025 | Change |
|---|---|---|---|
| Detached | £715,036 | £713,951 | +0.2% |
| Semi-detached | £417,700 | £411,023 | +1.6% |
| Terraced | £336,683 | £332,470 | +1.3% |
| Flat | £209,670 | £214,163 | -2.1% |
A semi-detached house is worth about £6,700 more than a year ago. A flat is worth about £4,500 less. Detached homes, which fell in last month’s figures, are now just above where they were.
The average first-time buyer paid £316,293, up 0.6%. Buyers who already own paid £499,667 on average, up 0.4%.
June’s rise has been revised into a fall
Land Registry keeps adding completed sales to recent months, so each month’s first figure is provisional. Last month we reported June as £402,790, up 0.2%, and warned that a change that small could flip.
It has. June now reads £401,337, down 0.1% on the year.
- June 2026: first £402,790 (+0.2%), now £401,337 (-0.1%)
- May 2026: was £397,393 (-0.6%), now £394,895 (-1.2%)
- October 2025, the district’s recent peak, has moved up from £408,933 to £409,668
So July’s average is still £5,986 below that October peak. And July’s 0.4% is itself inside the band that revisions have been moving.
How many homes are selling
Sales counts run a couple of months behind prices. The latest is May 2026, with 125 completed sales across the district. April has been revised to 104.
A year earlier, May 2025 recorded 132 sales. So the number of homes changing hands is broadly steady, even while the average price barely moves.
What it means for you
- If you are selling in West Berkshire, you are in the one part of Berkshire where values have held over the year. That is a point worth making to a buyer comparing Newbury with Reading or Wokingham.
- If you own a flat, yours is the only type of home in the district to have lost value, down 2.1%.
- If you are buying your first home, the average first-time buyer price of £316,293 is about £87,000 below the district average, because that average includes the big detached stock in the villages.
- Do not treat July’s 0.4% as settled. June’s figure changed direction within a month. Watch the level, not the sign.
- For your own street, our Newbury house prices page sets this index against the median price actually paid in each town and village.
The August 2026 index is due in mid-October.
Sources
- UK House Price Index for July 2026, HM Land Registry, published 16 September 2026
- UK HPI, West Berkshire, July 2025 to July 2026
- UK HPI full file, July 2026 and June 2026, used for the Berkshire and neighbouring comparisons, the England rankings, the sales counts and the revisions
- About the UK House Price Index, HM Land Registry, on how the index is calculated and revised
Have your say