
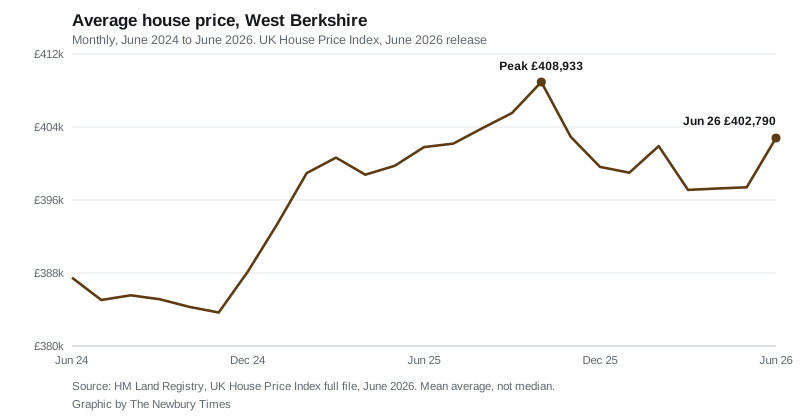
The average West Berkshire home cost £402,790 in June, still £6,143 below its October peak. Detached homes fell, semis rose, and May was revised down £3,305.
The average home in West Berkshire was worth £402,790 in June 2026, according to the UK House Price Index published by HM Land Registry on 19 August.
That is £991 more than a year earlier, a rise of 0.2%. It is also £6,143 less than the district’s peak of £408,933 in October 2025. Eight months on from that high, the local market has not got back to it.
The national picture is stronger. England rose 1.8% over the same year to £293,262. The South East as a whole managed only 0.3%.
Where West Berkshire sits
The full monthly index file covers all 295 local authority districts in England. On the June figures West Berkshire is the 76th dearest, and its 0.2% annual change ranks 67th from the bottom. Sixty-two districts recorded an outright fall.
Berkshire itself is pulling in two directions:
| District | Average, June 2026 | Change on the year |
|---|---|---|
| Windsor and Maidenhead | £576,992 | -2.2% |
| Wokingham | £498,941 | -3.1% |
| West Berkshire | £402,790 | +0.2% |
| Bracknell Forest | £396,103 | -0.2% |
| Reading | £361,243 | +0.9% |
| Slough | £352,024 | +2.2% |
The two most expensive districts in the county fell hardest. The cheapest rose most. Over the boundary to the north, the Vale of White Horse gained 6.3% and South Oxfordshire 5.2%, so this is not a regional slump so much as a very local one.
Detached down, semis up
The district average hides four different markets. West Berkshire’s June figures split like this:
- Detached: £713,343, down 0.6% over the year
- Semi-detached: £416,558, up 1.3%
- Terraced: £334,523, up 1.0%
- Flats: £210,435, down 1.1%
The two ends of the market lost ground while the middle held. A detached house in the district is now worth £4,223 less than in June 2025. A semi is worth £5,470 more.
The average price paid by a first-time buyer was £315,600, up 0.7% on the year. For someone who already owns, the average barely moved, at £498,567.
The figures for April and May have moved
Land Registry keeps adding completed sales to a month after it first publishes it, so the first version of any month is provisional. Both of the last two were cut this time.
- May 2026 was first published at £400,698, an annual rise of 0.2%. It now reads £397,393, a fall of 0.6%. That is £3,305 off the price and a change of direction.
- April 2026 was first published at £401,803, up 0.8%. It now reads £397,255, down 0.4%, a cut of £4,548.
We did not publish a story on the May figure, and this is why. In a district this size a revision of a few thousand pounds is enough to flip a small annual change from positive to negative. June’s 0.2% sits inside that same band, so treat the direction as unsettled and the level as the reliable number.
How many homes are actually selling
Sales volumes lag prices by about three months in this index, so April 2026 is the most recent count published: 102 completed sales across the whole district. March 2026 recorded 131.
The comparison with last spring looks dramatic but is not: 390 sales completed in March 2025 and only 82 in April 2025, either side of the stamp duty threshold change on 1 April 2025. Buyers rushed to finish before the deadline, which emptied the following month. Compare 2026 with 2024 rather than with that distortion.
What it means for you
- If you are selling, the district average is back above £400,000 but is still short of last October. Pricing to the 2025 peak is pricing to a level the market has not reached since.
- If you own a detached house, you are in the only part of the market that has lost value over the year, down 0.6%. Flats are down 1.1%.
- If you are buying your first home, the average first-time-buyer price of £315,600 is roughly £87,000 below the district average, because that average includes the detached stock on the downs.
- Do not read this figure as your street’s figure. UKHPI is a mean average for the whole of West Berkshire, from Newbury and Thatcham out to Lambourn, Hungerford and Pangbourne. Our Newbury house prices page sets it against the median price actually paid in each town and village, which for Newbury itself was £335,000.
- If you are watching a single month, wait. On this evidence any figure inside about half a percentage point either way can be revised away by the next release.
The July 2026 index is due for publication in mid-September.
Sources
- UK House Price Index, West Berkshire, HM Land Registry, June 2026 release published 19 August 2026
- UK HPI full file, June 2026 and May 2026, used for the district rankings and the revisions
- About the UK House Price Index, HM Land Registry, on how the index is calculated and revised
Have your say