
The average West Berkshire home rose £1,145 in September to £403,879, but is still 0.2% down on a year. Flats fell 2.6% while semis rose 0.8%.
The average home in West Berkshire was worth £403,879 in September 2026. That is £1,145 more than in August, a rise of 0.3% in a month.
It is still 0.2% down on a year, or £936 below September 2025’s £404,815.
The figures come from the UK House Price Index for September 2026, which HM Land Registry published this morning. September is a first estimate and is often revised the following month.
August was not as bad as first reported
Last month we reported August at £401,830, down 0.4% on a year. HM Land Registry has since revised August up to £402,734, which makes the annual fall 0.2%.
The district’s highest average on record is now given as £409,525, in October 2025. September’s figure is £5,646 below that peak.
What is rising and what is falling
The change over the year to September, by type of home:
| Type | Average, Sept 2026 | Change in a year |
|---|---|---|
| Detached | £715,882 | -0.2% |
| Semi-detached | £417,890 | +0.8% |
| Terraced | £336,846 | +0.3% |
| Flat or maisonette | £209,514 | -2.6% |
| All homes | £403,879 | -0.2% |
| First-time buyers | £316,593 | 0.0% |
Flats are still doing worst. Their average has been down on the year in every month of 2026 so far, from January to September.
Semi-detached homes are the strongest type, up 0.8%. The average first-time buyer price is exactly where it was a year ago.
Most of Berkshire is falling
Four of Berkshire’s six councils saw prices fall over the year. Only Windsor and Maidenhead and Slough rose. The districts west and north of West Berkshire are mostly rising.
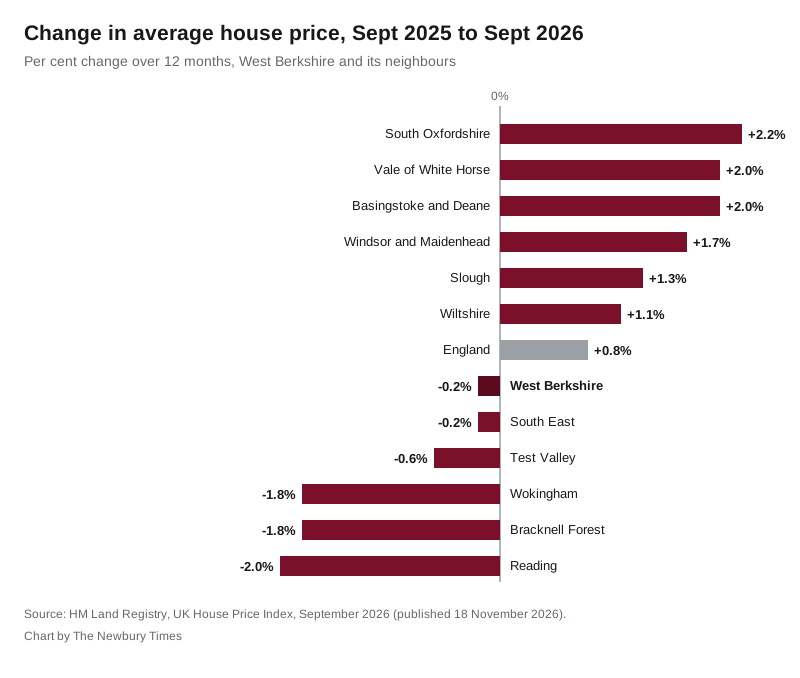
The Berkshire picture in September:
| Council | Average price | Change in a year |
|---|---|---|
| Windsor and Maidenhead | £594,584 | +1.7% |
| Wokingham | £494,973 | -1.8% |
| West Berkshire | £403,879 | -0.2% |
| Bracknell Forest | £392,056 | -1.8% |
| Reading | £348,245 | -2.0% |
| Slough | £347,052 | +1.3% |
Across the borders:
- South Oxfordshire rose 2.2% to £473,592
- Vale of White Horse rose 2.0% to £410,866, and is still dearer than West Berkshire
- Basingstoke and Deane rose 2.0% to £374,764
- Wiltshire rose 1.1% to £328,341
- Test Valley fell 0.6% to £369,776
The South East as a whole fell 0.2%, the same as West Berkshire. England rose 0.8%.
Of the 295 council areas in England, 108 saw prices fall over the year. West Berkshire ranked 196th for annual growth, up from 208th in last month’s first estimate.
Fewer homes are changing hands
The UK House Price Index is a mean average, not a median, and it is adjusted for the mix of homes sold. It rests on a fairly small number of sales in a district this size.
The latest complete sales count for West Berkshire is for July 2026: 171 sales, against 202 in July 2025. Counts for August and September are not yet complete.
Monthly moves of under 1% often reverse when the next release revises them. West Berkshire’s annual change has sat between -1.3% and +0.4% every month since February.
What it means for you
- If you are selling a flat, the local average is £209,514, down 2.6% on a year. Price against recent sales nearby rather than last year’s figure.
- If you are a first-time buyer, the average first-time purchase in West Berkshire is £316,593, unchanged on a year.
- If you want to check what sold on a particular street, our Newbury house prices page lists recent sales from the Land Registry’s price paid data.
October’s figures are due in December. Our previous report covered August.
Sources
- UK House Price Index for September 2026, HM Land Registry, published 18 November 2026. All figures are from the UKHPI full data file for September 2026, including the revised August figure, the property-type and first-time buyer averages, the July sales count and the ranking of 295 English council areas.
Have your say