
460 people aged 18 to 24 claimed out-of-work benefits in West Berkshire in August, up 30% in a year and the most since 2021. Newbury's wards led the rise.
460 people aged 18 to 24 were claiming unemployment-related benefits in West Berkshire in August 2026. That is the highest figure since November 2021.
A year earlier the figure was 355. The rise of 105 is 29.6%, almost three times the rate for the UK as a whole.
The figures are from the ONS claimant count, published through nomis on 15 September.
The district’s overall count rose too. It reached 2,425 in August, up 85 in a month and 125 in a year. That is 2.4% of residents aged 16 to 64, still well below the South East’s 3.1% and the UK’s 3.9%.
The young claimant count keeps climbing
Last month we reported the 18 to 24 count at 435 for July. The ONS has since revised July down to 425. August then jumped 35 in a single month.
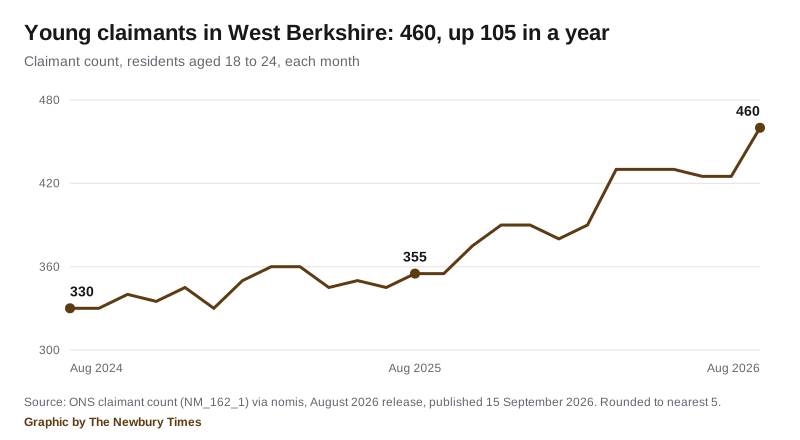
The count sat between 330 and 360 for more than a year. It started rising in October 2025, reached 390 by November and 430 by March. It has not dropped below 425 since.
Faster than anywhere else in Berkshire
The change in 18 to 24 year old claimants between August 2025 and August 2026:
| Area | Aug 2025 | Aug 2026 | Change | Overall rate |
|---|---|---|---|---|
| West Berkshire | 355 | 460 | +29.6% | 2.4% |
| Bracknell Forest | 370 | 435 | +17.6% | 2.8% |
| Wokingham | 390 | 445 | +14.1% | 2.0% |
| Windsor and Maidenhead | 330 | 365 | +10.6% | 2.5% |
| Reading | 855 | 915 | +7.0% | 4.3% |
| Slough | 930 | 935 | +0.5% | 5.9% |
| South East | 31,885 | 35,655 | +11.8% | 3.1% |
| United Kingdom | 308,935 | 339,875 | +10.0% | 3.9% |
West Berkshire still has one of the lowest overall rates in the county. Only Wokingham is lower. But its young claimant count is rising faster than any of its neighbours.
Almost all of the year’s rise is under-25s
West Berkshire had 2,300 claimants in August 2025 and 2,425 in August 2026. By age:
| Age | Aug 2025 | Aug 2026 | Change |
|---|---|---|---|
| 16 to 17 | 0 | 5 | +5 |
| 18 to 24 | 355 | 460 | +105 |
| 25 to 29 | 260 | 265 | +5 |
| 30 to 34 | 290 | 255 | -35 |
| 35 to 39 | 255 | 290 | +35 |
| 40 to 44 | 255 | 240 | -15 |
| 45 to 49 | 210 | 205 | -5 |
| 50 to 54 | 205 | 200 | -5 |
| 55 to 59 | 210 | 230 | +20 |
| 60 to 64 | 205 | 200 | -5 |
| 65 and over | 45 | 70 | +25 |
The 18 to 24 band accounts for 105 of the 125 extra claimants.
Newbury’s wards drove August’s rise
Ward figures show where the month’s increase landed. Across the district’s 24 wards the count rose by 75 between July and August. Newbury’s five wards took 55 of them, going from 860 to 915.
- Newbury Speen: 160 to 175, rate 3.7%
- Newbury Clay Hill: 160 to 175, rate 3.3%
- Newbury Central: 185 to 195, rate 3.9%, the highest in the district
- Newbury Wash Common: 90 to 100, rate 1.8%
- Newbury Greenham: 265 to 270, rate 2.9%, the most claimants of any ward
Outside Newbury, Burghfield and Mortimer rose by 20, to 145, the biggest single ward rise. Thatcham Central rose by 15, to 130. Aldermaston fell by 10, to 55.
At the other end, Chieveley and Cold Ash has the lowest rate, at 1.2%.
A caution on these ward numbers. Nomis rounds every count to the nearest five, so a change of five on its own means very little. The 24 ward counts add up to 2,420, against the district total of 2,425, for the same reason.
What the claimant count measures
The claimant count is not the unemployment rate. It counts people on Universal Credit who are required to look for work, plus the remaining Jobseeker’s Allowance claimants. Some are in work on low hours.
People who are out of work but not claiming do not appear at all. It is still the only monthly measure published down to individual wards.
What it means for you
- If you are 18 to 24 and looking for work in West Berkshire, there are more people in the same position than at any point since 2021. The National Careers Service helpline, 0800 100 900, is free and does not need a benefit claim.
- If you are hiring, the number of 18 to 24 year olds claiming and required to look for work locally is about 30% higher than a year ago.
- If you want to check a ward, the full series is free to query at nomisweb.co.uk.
The September figures are due on 20 October. For the other side of the local money picture, see our report on West Berkshire house prices in July.
Sources
- ONS claimant count, dataset NM_162_1, via nomis, August 2026 release, updated 15 September 2026. District, county, regional and UK figures are for all claimants aged 16 and over; rates are the share of residents aged 16 to 64; ward figures use wards as of May 2025. All counts are rounded to the nearest five.
- Labour market overview, UK: September 2026, Office for National Statistics, released 15 September 2026, next release 20 October 2026
Have your say